What if all your observability data was just parquet files?
If you work in SRE, DevOps, or observability it might be time to introduce yourself to the data engineers and understand what's going on with lakehouses, columnar storage, and a bewildering number of projects from the Apache Foundation. Some of the most interesting developments in observability in late 2025 are coming from analytics.
For people who have tuned out everything related to data warehouses since Hadoop:
- Columnar storage formats, Apache Arrow, and emerging schemas for OpenTelemetry are making it more realistic to do analytics on logs, metrics, and traces quickly and cheaply in object storage (S3, R2, MinIO, etc).
- duckdb lets you do analytics on all this data using regular SQL, including from inside your browser (feat. WebAssembly).
- Iceberg-based lakehouse1 architecture, now available via managed services like Cloudflare R2 Data Catalog and AWS S3 Tables2 that implement the Apache Iceberg spec, add convenient analytics, metadata and performance features on top of parquet files in object storage without needing to run a distributed compute cluster.
- The monitoring world is currently obsessed with AI agents and anomaly detection. By having OTel data in a lakehouse, Python/Pandas/PyTorch workloads run directly against Parquet without moving data.
Observability isn't a typical analytics workload: lots of small, highly concurrent writes present many technical challenges that have traditionally been left to specialized vendors ($$$). This is at odds with the overall lakehouse philosophy: stop shuttling data through multiple storage tiers and put it once into a managed table format on object storage so tools read from a single source of truth.
This post explores a prototype of how far you could get with cheap storage, some glue code written in rust, and open table formats for observability to understand if the big data ecosystem has arrived at the point where lakehouses could cost-effectively augment observability tools for longer-term analytics.
In this post, 'lakehouse' means what Armbrust et al. defined in their 2021 CIDR paper: data on cheap object storage in open formats (Parquet), with a metadata layer that adds transactions, schema evolution, versioning, and query optimization.
12/3/2025 update: The day after this post was published, Amazon released an automatic integration for S3 Tables from CloudWatch Logs. It makes all of the glue code below redundant for log sources in AWS.
Teaching duckdb to speak OpenTelemetry
A straightforward way to export OpenTelemetry data is to configure a collector with a file exporter and output a bunch of protobuf or JSON files to a local directory. See this example on OTelBin using the latest collector version (v0.139.0).
With JSON/protobuf files, querying this data remains neither easy nor fast with standard analytics tools. This is what duckdb extensions were designed for: taking external data and converting it into rows you can easily query with SQL.
I recently wrote and published a community extension that imports telemetry data from JSON or protobuf files. It uses a schema inspired by the Clickhouse OpenTelemetry exporter. Here's what it looks like in the duckdb CLI (v1.4.2 or later). duckdb makes reading multiple files or reading from HTTP/S3/cloud storage easy:
INSTALL otlp FROM community;
LOAD otlp;
LOAD httpfs;

-- Query slow traces
SELECT
    TraceId,
    SpanName,
    Duration / 1000000 AS duration_ms
FROM read_otlp_traces('https://raw.githubusercontent.com/smithclay/otlp2parquet/refs/heads/main/testdata/traces.jsonl')
WHERE Duration > 1000000000  -- over 1 second
ORDER BY Duration DESC
LIMIT 5;
This is enough to do some powerful analytics: it's trivial to join across signal types or correlate with non-observability data. You can also save any data (errors, slow traces, interesting logs) to parquet format with a SQL one-liner:
-- Query slow traces, write to Parquet
COPY (
    SELECT
        TraceId,
        SpanName,
        Duration / 1000000 AS duration_ms
    FROM read_otlp_traces(
        'https://raw.githubusercontent.com/smithclay/otlp2parquet/refs/heads/main/testdata/traces.jsonl'
    )
    WHERE Duration > 1000000000
    ORDER BY Duration DESC
    LIMIT 5
)
TO 'slow_traces.parquet' (FORMAT PARQUET);
So that's cool. There are two significant problems:
- Needs streaming support: OpenTelemetry data isn't usually accessible from JSON/protobuf files in production scenarios. It's streamed in real time from instrumented applications through various collectors and pipelines to specialized databases like Elastic or Tempo.
- Wrong formats: Naively writing a lot of metrics, logs and traces to small JSON/protobuf files kills the price and performance benefits of a data lake: object storage gets more expensive and queries get slower.
Next is what happened when I tried to convert OpenTelemetry to parquet in a Lambda function/Cloudflare worker and hoped for the best. Spoiler: object stores are great at cheap blobs, but less great at "thousands of tiny writes per second, forever."
Streaming OpenTelemetry to Parquet files
No duckdb extension is needed if metrics, logs, and traces are stored in parquet instead of JSON or protobuf. The OTel schema, especially for metrics, is far from trivial, but there are emerging projects exploring what it could look like including OpenTelemetry Arrow and OpenTelemetry on Delta Lake. These take advantage of the columnar, semi-structured, highly repetitive and compression-friendly aspects of OTel data: you could see file size reduction of up to 90%.
Thanks to the robust Arrow/rust/Apache ecosystem and Claude Code, I wrote a simple Rust library called otlp2parquet that handles these boring parts: decoding OTLP, mapping it into Arrow, writing Parquet, and dealing with cloud storage. It's profoundly cheap in terms of compute costs: log-to-parquet conversion using demo data came out to about $0.01/per uncompressed GB. That's a rounding error on cloud bills and doesn't even account for free tiers on Workers or Lambda.
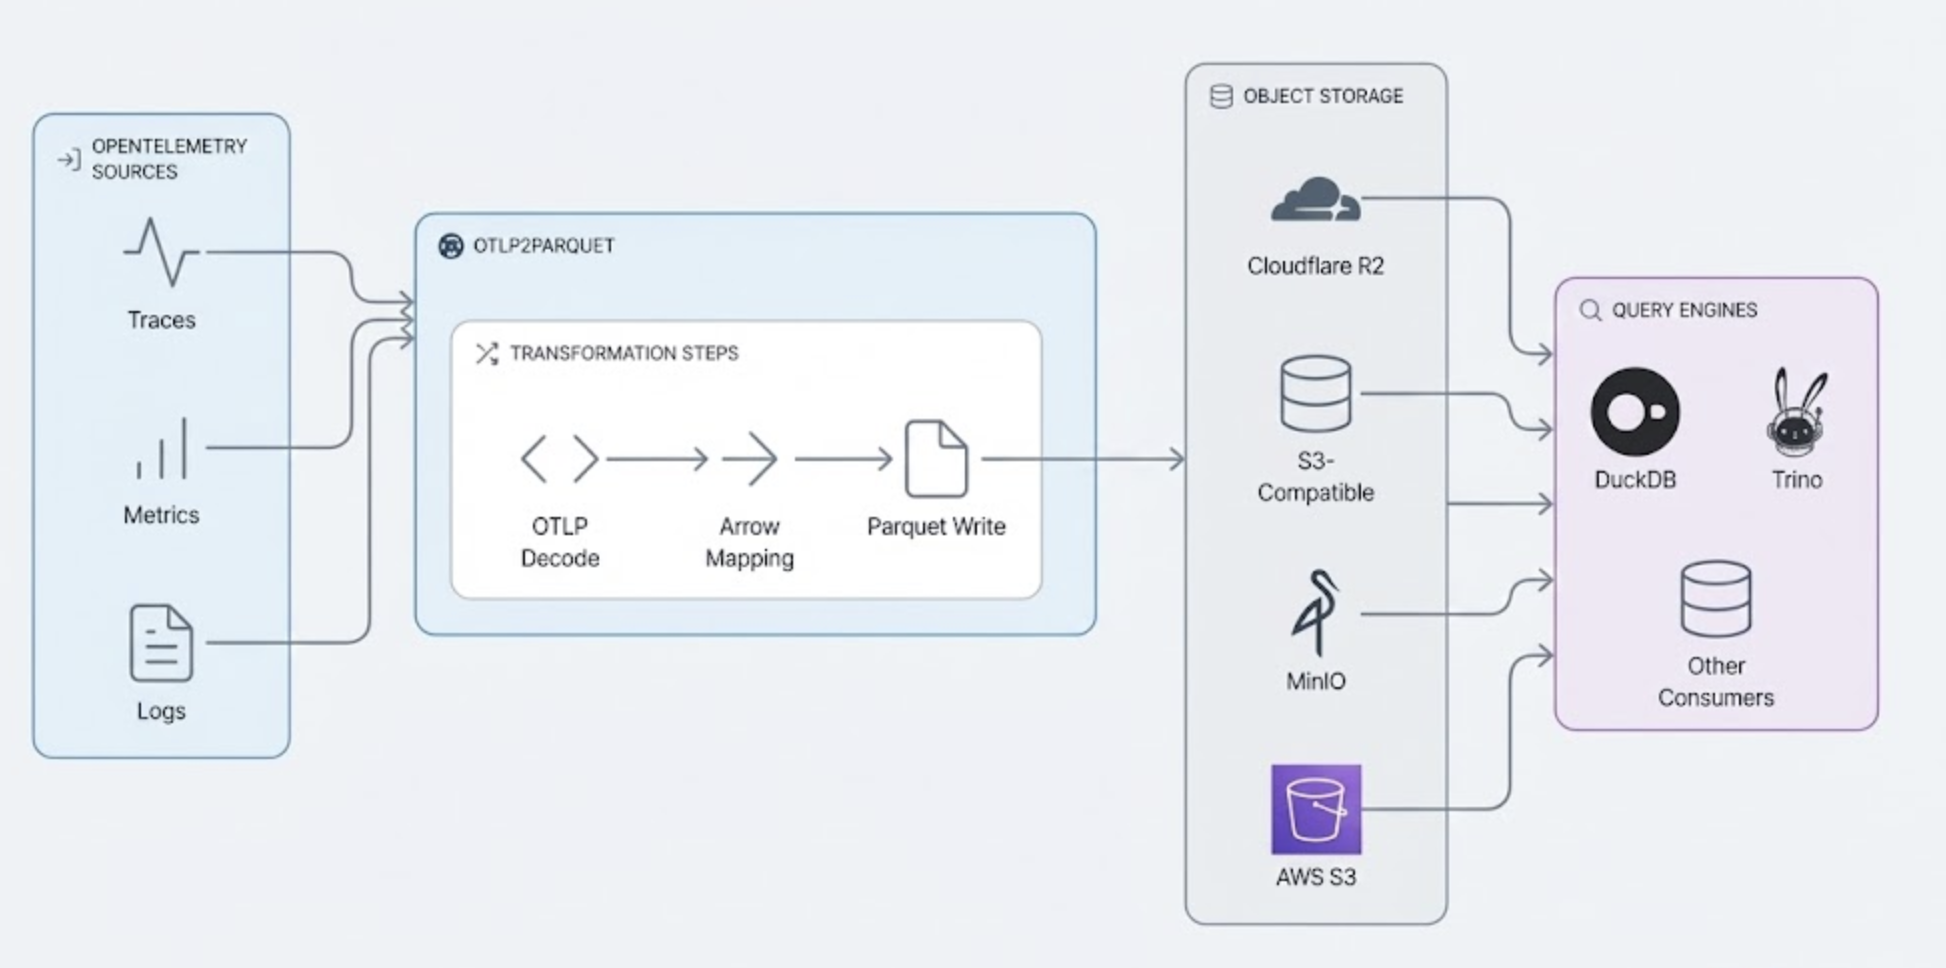
Parquet format means query engines benefit from only reading—and transferring over the wire—a significantly smaller amount of data when running a query like: "give me auth service logs in us-east-2 for the past hour." Only portions of the file are scanned.
Here's what a simple logs query looks like now. For maximum fun, you can even run this completely in your browser here.
LOAD httpfs;
SELECT Timestamp, ServiceName, SeverityText, Body
FROM read_parquet('https://github.com/smithclay/otlp2parquet/raw/refs/heads/main/testdata/parquet/logs.parquet')
ORDER BY Timestamp DESC
LIMIT 5;
So imagine you actually do this. A few months later, you've got 100k+ small Parquet files (a "data swamp") sitting in a bucket. How do you query it, what happens when you want to change the schema, add partitions for faster queries, or consolidate (compact) small files and metadata into larger files?
Writing to managed Apache Iceberg: S3 Tables and R2 Data Catalog
Enter catalogs like Apache Iceberg or Delta Lake, available as fully managed service on AWS and Cloudflare (among others). Data warehouses have traditionally been big, expensive, and complex. This is starting to change with more or less "managed bucket" cloud services based on Iceberg that provide both the cheap storage and catalog/metadata management service in one.
Iceberg handles snapshots, partitions and schema changes so your query engine doesn't have to crawl a bucket listing every time. These catalogs somewhat help wrangle the million tiny files problem, but they don't magically erase it. Someone still has to pay for compaction and decide how aggressively to merge things.
(Fun fact: Cloudflare R2 Data Catalog has no additional cost for egress or using it over regular storage while in beta.)
With managed Iceberg services, you get lakehouse-like semantics for working with OpenTelemetry in addition to performance benefits, like more efficient reads. In lakehouse terms, otlp2parquet plus R2 Data Catalog/S3 Tables are the metadata and transaction layer over Parquet. DuckDB is one of potentially many SQL/ML engines on top.
Here's what it looks like connected to a Cloudflare R2 Data Catalog in duckdb. Once the connection is made, you query the data using regular SQL.
--- Credentials to read R2 buckets
CREATE SECRET r2_secret (
      TYPE S3,
      KEY_ID 'ACCESS_KEY_ID',
      SECRET 'SECRET_KEY',
      ENDPOINT 'ACCOUNT_ID.r2.cloudflarestorage.com',
      REGION 'auto');

--- Credentials to read catalog metadata
CREATE SECRET r2_catalog_secret (
      TYPE ICEBERG,
      TOKEN 'API_TOKEN');
ATTACH 'ACCOUNT_ID_BUCKET_NAME' as iceberg_catalog (TYPE ICEBERG, ENDPOINT 'https://catalog.cloudflarestorage.com/ACCOUNT_ID/BUCKET_NAME');

--- Attach catalog
ATTACH 'account_bucket' AS iceberg_catalog (
    TYPE ICEBERG,
    ENDPOINT 'https://catalog.cloudflarestorage.com/<account-id>/<bucket-name>'
);

--- Show available metric/log/trace tables
SHOW tables FROM iceberg_catalog;
There's a big caveat: this pattern assumes batch commits, but observability forces you to confront what freshness means for streaming telemetry. Lakehouse systems assume a small number of writers doing big transactional commits... OTel looks more like a million tiny writers. A production scenario needs well-designed queues and aggregators (potentially just a well-tuned OTel collector) so that only a small number of writers update the Iceberg metadata.
Thanks on a helpful pointer from a GitHub issue, am also exploring improved batching in otlp2parquet using Cloudflare Durable Objects.
There are several open source projects and startups trying to solve the "streaming database" problem in a more production-ready way: see Apache Fluss, Risingwave or moonlink. An observability startup called Parsable, built on top of object storage and parquet, details their solution for this here.
Observability's data engineering moment?
The observability team and the data engineering team may see each other at the company holiday party this year but probably don't eat lunch together. This is too bad: there's genuinely interesting stuff happening in the big data ecosystem.
I don't think a lakehouse replaces your existing observability stack, but may eat its cold storage. A cheap, analytics-friendly back-end for long-term retention, weird one-off questions, and joining telemetry with the rest of your data is where it gets interesting. Youn own data storage you own also simplifies complex and growing regulatory requirements (PII, GDPR, etc).
It's already shaking up how people do analysis on large amounts of geospatial data, maybe logs and traces will be next.
If a standard schema and streaming patterns can be figured out, the combination of cheap and queryable observability data, located entirely within the cloud of your choice, might make data lakes for metrics, logs, and traces much more common and usable.
The data engineers might be using the components of your next observability stack.